Gold as an Inflation hedge?
A
few days ago, I was discussing some market-related events with a mate of mine.
Actually, this was right after Netflix had a 20% correction. Anyways, we were
talking about the US rates possibly rising and other Central Banks following
the same process. Also, since we know "for sure" that inflation is
here (regardless of transitory or not), the conversation quickly shifted to the
mighty alternative asset: THE GOLD. An asset class that has been
around thousands of years and also probably the only asset class which has more
stories made up about it than empirical evidence.
In
an attempt to clear the questions that were in my head, I stumbled upon research
done by Harvey and Erb (2013) where they ask questions like, "Just how
much of a hedge the gold really is against inflation?" and "What
happens if the central bankers of emerging nations start hoarding gold like
that of their developed counterparts?". I will try to review and add some
more data to the questions answered by the authors. The authors tackle these
specific arguments in the paper:
1.
Gold provides an inflation hedge (the most classic one)
2.
Gold serves as a currency hedge
3.
Gold serves as an attractive alternative to assets with low real returns
4.
Gold is safe heaven in times of stress
5.
Gold should be held because we are returning to a "de facto" world of
a gold standard
6.
Gold is "under-owned"
Covering
all of the points above would be very long for a blog spot. So, I will rather
dedicate each post to discussing in detail one specific argument. To start off,
we have the argument of inflation hedge.
GOLD AS AN INFLATION HEDGE
The
literature points out that gold has generally been a bad hedge against
inflation in the short run and a relatively good hedge in the long run.[1]
Here, the short run and long run are defined loosely to be the next few years and
about a century respectively. The “gold-as-an-inflation-hedge” argument
basically posits that inflation is a fundamental driver of the price of gold.
In other words, if inflation rises by 10 percent per year for 100 years, the
price of gold should also rise by roughly 10 percent per year over the same
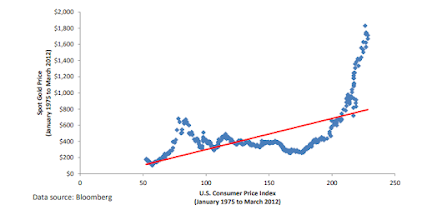
period. To see whether this relationship holds, the authors conduct a simple
regression analysis to examine the causal relationship between the nominal price of
gold and the consumer price index (CPI) on the data from January 1975 to March 2012.[2]
Figure 1 shows the result that the authors got when the nominal price of gold was regressed
on the contemporaneous value of the U.S. CPI.
I tried to then extend the data further and replicate this analysis. The following plot is the result of the simple regression analysis in which the 1-month futures contract price serves as the dependent variable and the monthly CPI figure takes the role of the independent variable. The data starts from Jan 1975 and ends in December 2021.

As we can see from both the plots above, the positive relationship is there but the price tends to fluctuate widely around the line of best fit. Another way to look at how effective gold has been in its role as the ultimate hedger of inflation is to observe the real price of gold. Whenever we think about determining a real value or return of any asset, an obvious method is to simply subtract the inflation component from the nominal value or returns. In our case, we have the nominal price of gold and the CPI value.
Well, if we try to just subtract these two data points and create an interval scale, the result shall not be very useful. This is because of how the interval scales work. Although the intervals are fixed and equal, the weight carried by each interval is different. To better understand the data, a ratio scale should be used. In our case, this would simply be dividing the nominal price of gold by the CPI value i.e. (Price/CPI value). This can be thought of as a price multiple that is used very frequently in equity valuation such as book-to-market (BE/ME), earnings-to-price (Earnings yield), etc.
The authors report that since the inception of gold futures trading, the real price ratio has averaged about 3.2 from the data between Jan 1975 to March 2012. The current ratio mentioned in the plot represents the data for March 2012. The fluctuations and trend of this ratio can be observed in the following figure:

Similarly, for this as well, I tried to update the plot and check what is the situation with regards to the price-to-CPI ratio at present time. As you can see below, the average has increased slightly compared to what the authors had calculated until 2012. The mean price ratio (red line in the graph) went up from 3.2 to 3.77 whereas the real price of gold (in terms of multiple) has been quite volatile after 2012. This can be seen in the large drawdown experienced between 2013 and 2018. This result might further validate the author's claim that the real price of gold tends to mean revert over time. These types of large drawdowns and variability in the real price of gold suggest that it has been a poor short-term inflation hedge.

So, in a nutshell, today we discussed the role of gold as a viable hedging instrument. Even though the market narrative is "Gold is the real money", the data seems to suggest something different. A further analysis is of course warranted on this topic. So, stay tuned!
[1] See Jastram (1978) and
Harmston (1998).
[2] Note that there are many types of CPI. The one used here is the CPI
for All Urban Consumers (All Items in U.S. City Average).
References
Erb and Harvey, 2013. The Golden Dilemma. Financial Analysts Journal, 69(4), pp. 10-42.
Data sources
Macro trends (https://www.macrotrends.net/futures/gold)
St. Louis Fed (https://fred.stlouisfed.org/series/CPIAUCSL)
Comments
Post a Comment